
Welcome to SWPhylo
Help (Current Page)
Seqword Project Main Page (More about the project)
Download Example file (Test the program with these)
Program for Download (Work at your own leisure)
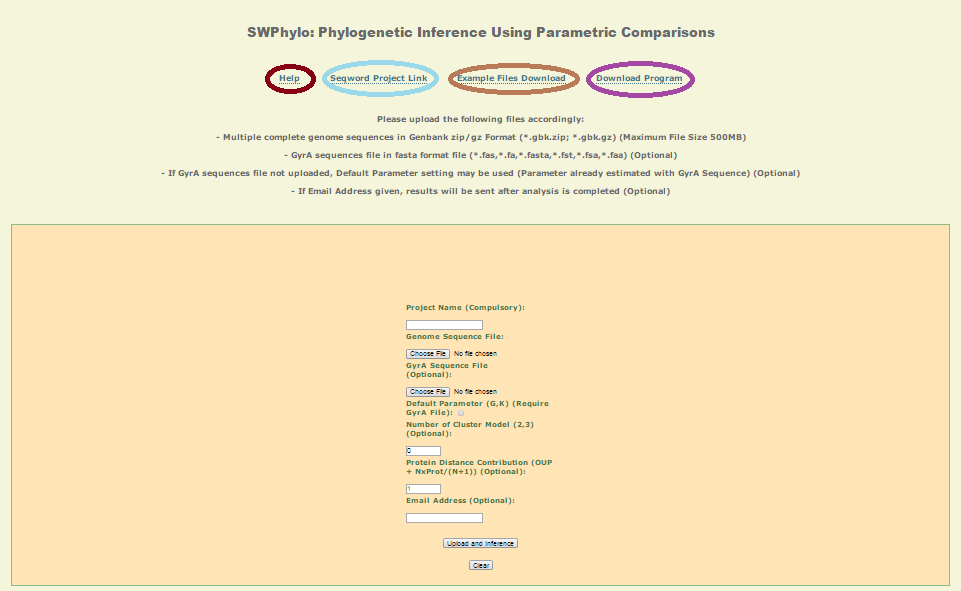
Input:
Genbank files of organisms under analysis within one zip file for upload.
GyrA protein sequence of organisms matching the above file in fasta format.
Optional: if not uploaded, an Oligonucleotide pattern phylogenetic tree will be inferenced.
Only GyrA protein sequence file accepted.
Default Paramter Checkbox
Optional: If checked, default parameter already estimated will be used to do the phylogenetic analysis with GyrA sequence of several groups of bacteria sequences (Bacillus, Corynebacteria, Enterobacteria, Lactobacilli, Mycobacteria, Pseudomonas, Prochlorococcus, Thermatoga).
Number of Cluster Model
Optional: Only Applicable when GyrA protein sequence is uploaded. Clustering will result in restricting species with similar clusters to related more closely to each other based on the integrated information of GyrA gene and OUP of whole genome sequence. This option restricts the number of clusters the program will created instead of default where the program determines the best clustering solution.
Protein Distance Contribution
Optional: Only Applicable when GyrA protein sequence is uploaded. Value N determines the weighting of GyrA distance within the final inference metric. It is advised to use a value of 2 when closely related species are compared, and the value 3 to distinguish between subspecies of the same species.
Email Address:
Optional; Depending on the size of the dataset uploaded (Max 512MB), an email address can be entered as when the results are done, it will be automatically be emailed to this address.
Output:
Phylogenetic Tree:
Oligonucleotide Usage Pattern Tree: Sequence File only as input.
Reconciliated Tree: Sequence File and GyrA sequence file as input.
Single Asterisk: Outlier sequence based on over represented variance compared to average.
Double Asterisk: Outlier sequence based on underrepresented variance compared to average.
Cladogram:
Created using sequence file and GyrA file. Pairs of genomes are grouped according to logistic clusters based on evolution niche.
Organisms are clustered based on verhulst model and zoned according to each cluster. These clusters serve as a guide tree where organisms within each zone share a closer evolutionary niche compared to other zones.
Logistic Cluster:
Clustering is done on the relationship between Oligonucleotide distance and GyrA distance between pairs of genomes.
Chisqr value returned as a message stating how the fitting is based on given dataset. VG – Very Good, Good, Mod – Moderate, Bad, VB – Very bad
Parameter G and K is for base verhulst model is given.
Results:
All graphs (Phylogenomic Tree, Cladogram, Logistic Clustering Plot) are downlable svg files.
Distance table (Phylogenomic Tree Inferencing Table), Clustering Table (Cladogram) and Phylogenetic tree (.tre) are downloable text files.
If Email option is used, all downlable files are emailed as link and will be saved for a 24 hour period on the servers.